7. Analytics
This guide covers how to locate and understand the analytics data we provide for all websites hosted on WPMU DEV Managed WordPress Hosting.
Analytics tab
Analytics data for any site is located under the Analytics tab of that site’s Hosting manager.

Within the Analytics tab, site data is broken down into three categories, each with its own tab:
- Live Stats – real-time resources and usage information
- Storage Stats – the amount of storage used and remaining
- Visitors – Traffic analytics and how it is impacting bandwidth
7.1 Live Stats
Copy chapter anchor to clipboardThe Live Stats dashboard provides an overview of site health and performance in realtime. A spike in traffic or reduced performance can be indicators of an attack or the need to upgrade to a larger plan.
Note that the Live Stats feature is not available for sites on the Quantum plan. See Quantum Plan Restrictions for details.
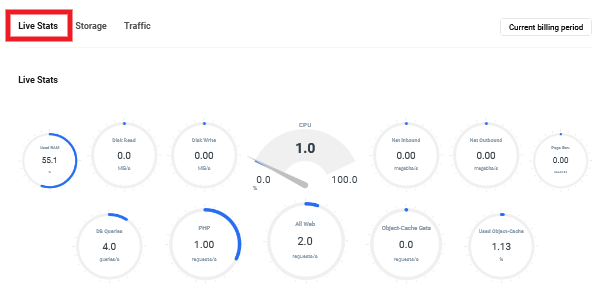
Here is a brief description of the Live Stats metrics and what they track:
- CPU (Central Processing Unit) – This is the server load being generated by your website at any given moment
- Used RAM – The Random Access Memory, or physical memory, being used by your website. Note that it is perfectly normal to see this indicate 40-50% usage even if there is zero traffic or activity on the site. This is because, at any given time, there can be numerous processes running on the server, including but not limited to NGINX, PHP, MySQL, static server cache, WAF, WP Cron, Netdata, Fail2ban, any Hub/Hosting actions, etc.
- Disk Read – Load put on the hard drive of the server by content being read (generally not a very intensive task)
- Disk Write – Load put on the hard drive of the server by content being written
- Net Inbound – Amount of data being received by the network
- Net Outbound – Amount of data being sent to your network at any given time
- Page Gen – How long it takes to run the PHP code and generate the HTML page that is sent to the user
- DB Queries – Number of queries being made to your database
- PHP – Counts PHP requests only
- All Web – Requests per second being currently served (this accounts for all the pages and all assets requested from the server)
- Object-Cache Gets – Measures the number of requests that are a hit to object cache
- Used Object-Cache – Caching data and objects in the RAM for speeding up your site
Contact Support for help analyzing long-term, irregular performance or slower than expected load times for your website.
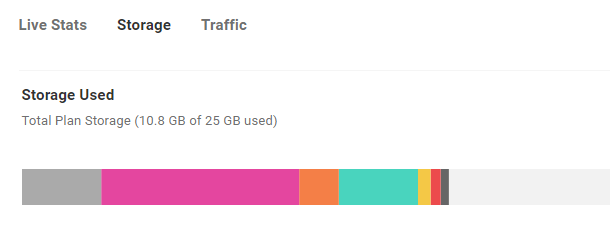
7.2 Storage
Copy chapter anchor to clipboardThe term “Storage” refers specifically to the SSD storage capacity provided with each of our hosting plans. Features like dedicated RAM, CPUs and bandwidth are essential performance factors but have no impact on storage capacity or usage.
Your System storage takes up a portion of your total plan storage and is split across:
- Operating System
- Hosting Packages
- Swap
- Logs & Temp
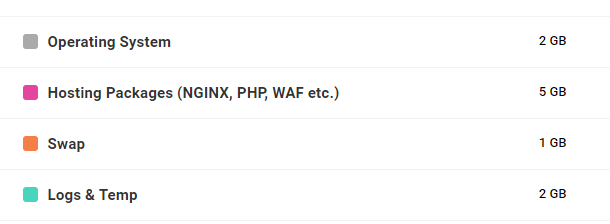
This System split is discussed further in the Storage Overview documents.
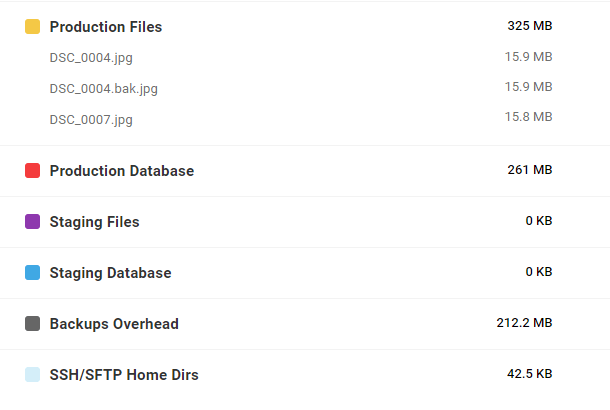
The Storage tab displays storage usage and available storage for your individual site. See our Storage documentation for a thorough discussion of each.
- Production Files
- Production Database
- Staging Files
- Staging Database
- Backups Overhead
- SSH/SFTP Home Dirs
Check available hosting plans for increasing storage space.
It’s normal to observe a difference of around 100-200MB between the storage size displayed on WordPress > Tools > Site Health Info and the value displayed on the Hub analytics. But, if this difference is significantly larger, it might be due to WordPress caching the Directory and Sizes data, causing a delay in reflecting the actual storage size changes when files are deleted or removed. To view accurate storage data, you’ll need to clear all caches, including the WordPress transients and the Object Cache. You can use the Hummingbird’s Database Cleanup feature to clear the cache.
7.3 Traffic
Copy chapter anchor to clipboardThe Traffic tab tracks:
Visits – The number of unique IP addresses in the access log in a 24-hour period, excluding common bots. The purpose is to approximate traffic-generated server load to help decide which hosting plan you may need.

Requests – Requests are a count of any dynamic request that hits PHP on your server. This includes bots and is a good measure of what is actually generating your server load.
Bandwidth Usage – Total bandwidth usage and the daily average for the period selected.
Use the date range selector to quickly toggle between stats for:
- Current billing period
- Past 7 days
- Past 30 days
- Past 90 days
- Past Year
7.3.1 Defining Visits and Requests
Link to chapter 3In simplest terms, Visits are the number of unique IP addresses that accessed your site during the selected time period, minus static files like images. We exclude static activity because a complete page load seldom occurs when a static asset is the target.
The Requests stat is the total number of times your site’s pages were viewed during the selected time period including all bot traffic because it gives more accurate management of requests that affect server load. A single visit may involve multiple Requests.
In practice, it works like this: A unique IP address accesses your site and fully loads a page. That counts as a Visit and Request. If that same IP address then loads another page on your site, it’s not a new visit, but it does count as a Request.
Visits
The Visits stats displayed in the Analytics Overview include both the total number of unique visits to your site during the past 30-days (157 in the example below), and the average number of visitors per day (6 in the example below).

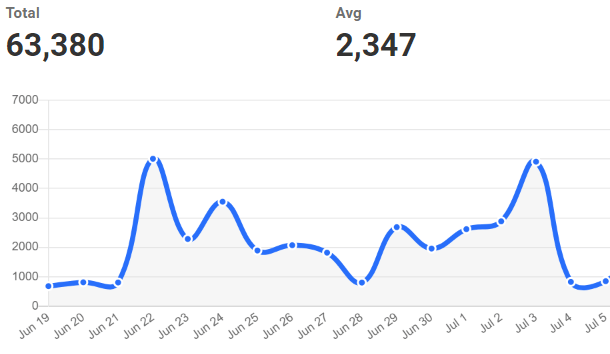
Requests
The Requests stats displayed in the Analytics Overview include both the total number of requests during the past 30-days (63,380 in the example below), and the average number of requests per day (2,347 in the example below).

7.4 Server Analytics vs GA/Jetpack
Copy chapter anchor to clipboardOne of the most common questions regarding our Hosting Analytics is: Why do my Hosting Analytics stats differ from those provided by Google Analytics or Jetpack or my WPMU DEV Dashboard Analytics?
Our server-side stats will always differ from third-party analytics services like Google Analytics (GA), Jetpack or the analytics provided via the WPMU DEV Dashboard plugin (which uses the analytics engine provided by Matomo). This is because our servers track activity by IP address, whereas third-party services do so by setting a cookie.
Every IP address that accesses your site is recorded in our server logs. We display the results as Visits and Requests on the Analytics page of your Hosting Overview. The criteria for a legitimate visit is described in the Defining Visits and Requests section of this document.
For GA, Jetpack or the Dashboard plugin’s analytics to work, a JavaScript file must be downloaded to the visitor’s browser and executed. If the JavaScript file is executed properly the browser will send a request to the third-party servers, and all the activity involved with that visit —known as a session— is recorded. If anything prevents that JavaScript file from executing properly, however, the session will not be recorded.
It’s as simple as that. IP tracking records everything; third-party tracking doesn’t. For example, if cookies, JavaScript, or images are disabled in the visitor’s browser or the visitor clicks out of a page before the JavaScript file executes, GA, Jetpack or the Dashboard won’t record the session, but our servers will.
Another example, specific to GA, involves the tracking codes which must be present on any page you want to be tracked. If a tracking code is incorrect or absent from a given landing page, visits to that page will be recorded by our servers but not by GA.
Finally, there are bots, and while not all bots are bad bots, they do impact the load on your server, so we count them. GA and Jetpack will ignore identifiable bot traffic if you tell them to. Still, if a bot successfully spoofs a legitimate user from time to time, that can contribute to discrepancies in your stats.
To be clear, we’re not suggesting that GA and Jetpack aren’t great services. They are. However, some users find configuring GA overly burdensome or are wary of JavaScript tracking for security reasons. For these users, our server stats provide a reliable view of site activity.
If you find configuring Google Analytics intimidating but would like a simple way to activate it on your site, we developed our plugin Beehive Pro (also available free on WordPress.org). The plugin walks you through configuring GA for either a single site or Multisite network and displays your analytics data in your site or network dashboard.
7.5 Understanding Bandwidth
Copy chapter anchor to clipboardThe bandwidth provided with your hosting plan represents the maximum amount of data that can be transferred to and from your site or network at any given time.
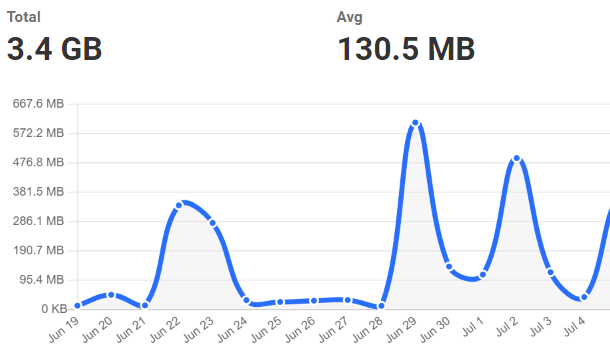
Your bandwidth stats are displayed along with your traffic stats in the Analytics Overview to make it easy to analyze how site activity impacts your bandwidth usage.
The Bandwidth stats displayed in the Analytics Overview include both the total bandwidth used during the past 30 days (3.5 GB in the example below) and the average bandwidth used per day (127.7 MB in the example below).

The classic bandwidth analogy is that of a highway, where the highway is your available bandwidth and the cars are data. Most of the time traffic moves smoothly, entering and exiting the highway with ease. If too many cars enter the highway at one time, however, traffic backs up.
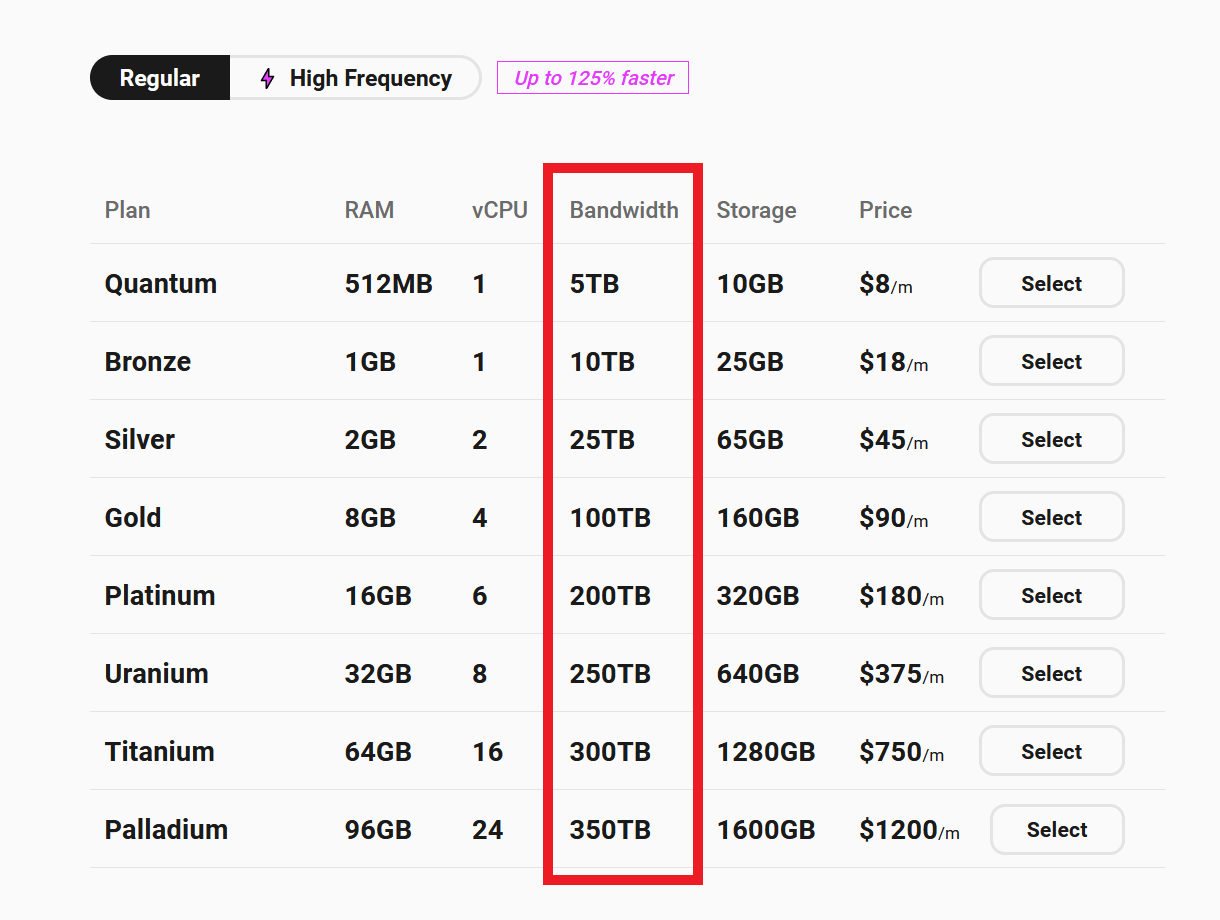
We do not set hard limits on site traffic, but sites that exceed their hosting plans’ recommended traffic levels will experience performance issues. That’s why we provide recommended bandwidth limits for each plan to help you determine which plan will be right for you.
7.5.1 Estimating Bandwidth Needs
Link to chapter 5It is difficult to predict how much bandwidth you need unless you are an experienced web admin. Usually, at least a couple of months of accumulated data are required to make a reliable estimate. Once you have some good data to work with, calculating your bandwidth requirements is relatively easy.
If you manage multiple stand-alone sites on one account or a multisite network the following calculations must include all sites.
First, multiply your average daily visits by the average requests per visitor. For sites we host, these stats are available in the Analytics Overview.

Next, multiply the results from the first step by your site’s average page size. Calculating average page size can be accomplished simply with an online site analyzer like GTmetrix.
If your site offers downloads then you’ll need to multiply how many downloads occur each month by the average file size. Add that figure to the total from the first two steps.
The result of these calculations is your minimum monthly bandwidth needs, the operative word being minimum. You should always have more bandwidth than you need to avoid performance issues or even outages when your site experiences a surge in traffic.
We recommend maintaining at least twice the minimum required bandwidth because surges in traffic tend to be exponential. The last thing you want is performance issues when your site is “hot”. Not only do you miss the chance to attract new visitors, but you also risk turning off existing users.
7.5.2 Avoiding Downtime
Link to chapter 5If we host your site you’ve already taken an important step toward avoiding bandwidth-related downtime because our hosting plans do not skimp on bandwidth. Even our Bronze plan provides 1TB of bandwidth.
Here are some other steps you can take:
- Monitor your bandwidth – You can’t anticipate problems if you aren’t paying attention. Periodically check your bandwidth usage stats in the Analytics Overview, paying particular attention to periods of peak usage.
- Design a clean site – Clunky themes, excess JavaScript files, and even plugins you no longer need, create extra data that your bandwidth is trying to transfer. Our Hummingbird Pro plugin, available free for all WPMU DEV members, will identify and offer solutions to most of your site’s inefficiencies. Also, read Optimizing Your WordPress Database – A Complete Guide to gain a thorough understanding of your WordPress database and how to maintain it at peak efficiency over time.
- Optimize Images – Images are critical to an attractive site, but they can bloat a site faster than just about anything else. Our Smush Pro image optimization plugin can automatically optimize and resize every image in any directory the moment it’s uploaded, saving space and bandwidth. Read The Ultimate Guide to Image Optimization to gain a thorough understanding of the importance of image optimization.
- Host Videos Elsewhere – Hosting audio and video files are rarely worth the space they require. Not only do they eat up resources, but they also increase your backup size tremendously, making it difficult to restore WordPress from backup. Instead, you should use an audio and video hosting service like YouTube, Vimeo, SoundCloud, etc.
- Use a CDN – A CDN, or a Content Delivery Network, is a cluster of servers located in data centers around the world that specialize in caching content to improve site speed and reduce the burden on the servers that actually host your site. While a CDN, like Cloudflare, might be overkill for the average blog, large multisite networks and e-commerce sites are relying on them more and more to reduce the chances of bandwidth-related outages. Read Why You Should Be Using a CDN to help you determine if a CDN is right for you.
7.6 Get Support
Copy chapter anchor to clipboardIf you still have questions or need assistance after reading this document, please don’t hesitate to contact our support superheroes using the available options under the Support tab in your Hub or via the Support tab in your WPMU DEV Dashboard.


