17. Reports
This guide explains how to use the Reports feature in the Hub 2.0 to create comprehensive, white-label, activity and performance reports for yourself and your clients.
Reports pull data from your active plugins & services and create reports covering Updates, Security, Backups, Performance, SEO, Analytics and Uptime, and will deliver these reports directly to your email.
You can see, at a glance, which of your sites have Reports scheduled on your Hub > Sites screen. If the Report icon is green, it means you have set up a report schedule for that site, and hovering over it will display info about the next report you’ve scheduled.

If the Report icon is grey, it means you’ve not yet scheduled any report for that site, or have only created once-off reports for that site.
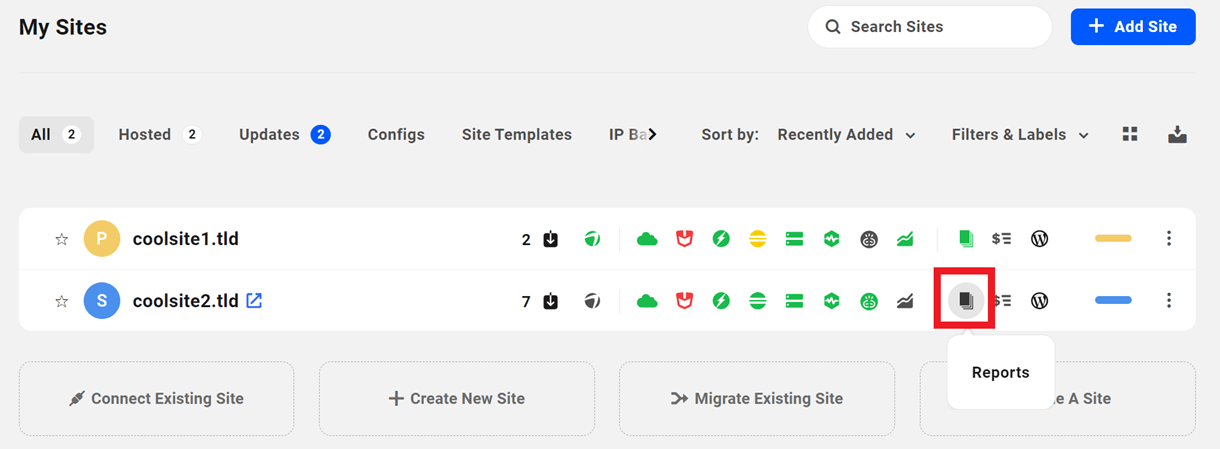
Click the Report icon there for any site to go straight to the Reports Dashboard where you can create and manage your reports for that site.
Of course, for Reports to work, your site must be connected to The Hub. If you haven’t connected a site yet, see our Add A Site to Hub 2.0 documentation for a super simple walk-through.
17.1 Create New Report
Copy chapter anchor to clipboardWhen you’re ready, click the Report icon on your Hub > Sites screen for the site you want. Or, if you’re already viewing the site you want, click the Reports tab there.
Then click the Create Report button to access the Reports control panel.

17.1.1 General
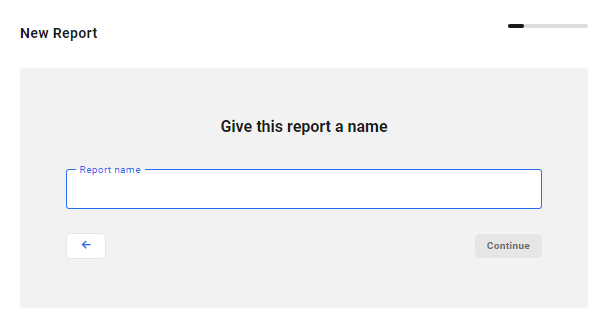
Link to chapter 1For any new report, you’ll first be prompted to give the report a name. The name you enter here will be used to identify the report in the list of all reports in your Hub, and will also appear in the name of the report PDF emailed to you. Enter your desired name and click the Continue button.
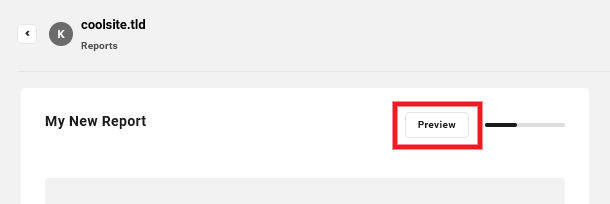
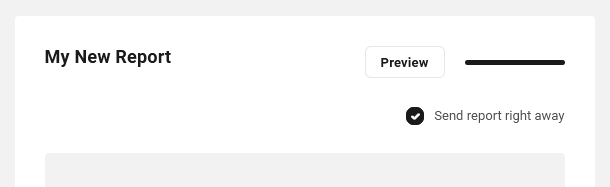
From this point onward, you’ll see a Preview button in the top right-hand corner that enables you to see a preview of your report cover.
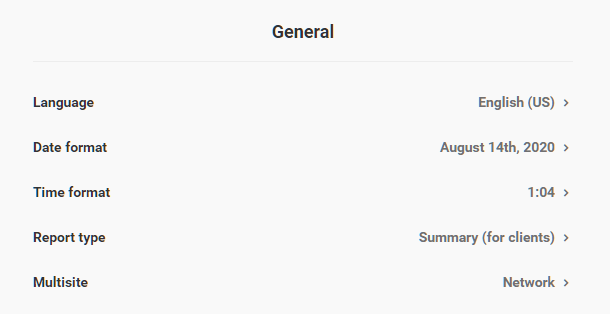
On the next screen, you can configure the following options:
- Language – Select the language you prefer for your report.
- Date format – Set the preferred format for all dates that appear in the report.
- Time format – Choose the preferred format for all timestamps that appear in the report.
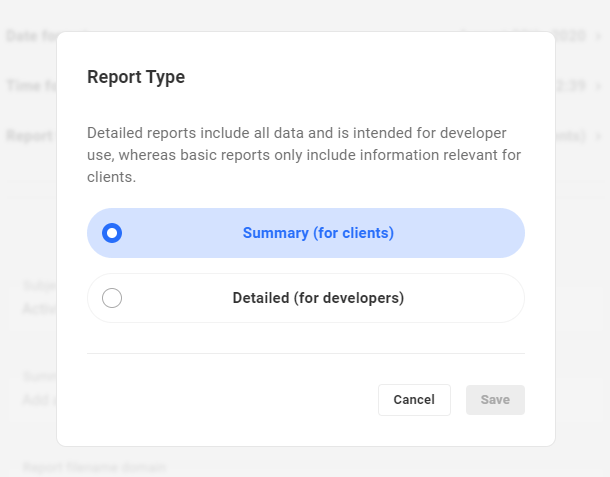
- Report type – Select either the Client or the Developer report type. The difference between these two report types is the amount of detailed information provided. Choose Client for a summary or select Developer for a more in-depth report. A full list of exactly what is and isn’t included in each report type can be found here.
- Multisite – If you’re creating a report for a multisite, you can choose to have it created for the whole network, just the primary site, or a specific subsite. Note that the primary site option will always take ID=1 so be sure to make your primary site match ID 1 to avoid any issues.
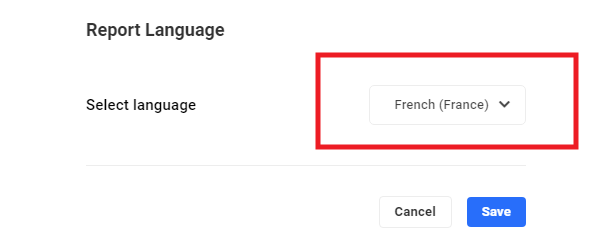
Language
All reports will be generated in English (US) by default, but you can change that and generate your report in one of 20+ different languages straight out of the box.
To change the language for your report, click on the current language that shows there, then click the dropdown menu in the modal that pops open to select from among the available languages. Then click Save.
If your language is not available, you can contribute to Hub Report translations here.
Note that a language locale must be at least 80% complete for it to appear as an option in the Language selector.
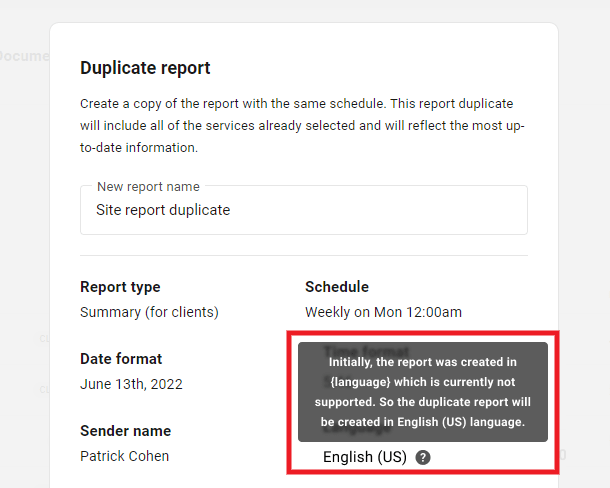
If you had previously created a report in a language that is no longer available, then select to duplicate that report, the duplicate will default to English (US) instead. A tooltip will appear in the Duplicate report modal to remind you of this.
Date format
To customize the date format for your report, click on the current date that shows, then select the date format you prefer in the modal that pops open. You can also set any custom format you like; see below for details on formatting. Remember to click Save when you’re done.
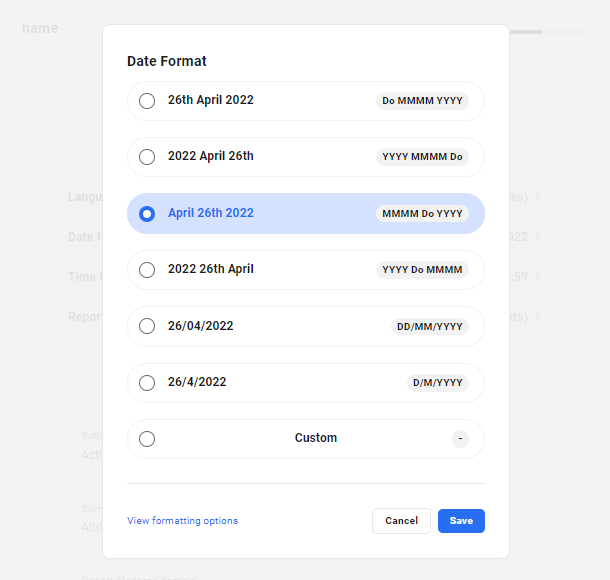
By default, a report will be stamped with a date and time in MMMM DD, YYYY [at] h:mm – which translates to January 01, 2018 at 00:00 am as an example.
The most widely used formats are:
- day-month-year (DMY) – DD MMMM YYYY which translates to 01 January 2018
- year-month-day (YMD) – YYYY MMMM DD which translates to 2018 January 01
- month-day-year (MDY) – MMMM DD YYYY which translates to January 01 2018
- year-day-month (YDM) – YYYY DD MMMM which translates to 2018 01 January
The above can be modified using separators for the components:
- “/” – stroke (slash)
- “.” – dots or full stops/points (periods)
- “–” – hyphens or dashes
- ” ” – spaces
- “,” – commas
For example, writing MM/DD/YYYY will give you 01/01/2018.
Day, Month and Year can be additionally tweaked to your liking as:
- DD – a two-digit day of the month (09, 10, etc.)
- dd – a two-letter abbreviation of the day of the week (Su, Mo, etc.)
- ddd – a three-letter abbreviation of the day of the week (Sun, Mon, etc.)
- dddd – the day of the week spelled out (Sunday, Monday, etc.)
- MM – a two-digit month (09, 10, etc.)
- MMM – a three-letter abbreviation for a month (Mar, Apr, etc.)
- MMMM – month spelled out in full (April, May, etc.)
- YY – a two-digit year (20, 21, etc.)
- YYYY – a four-digit year (2020, 2021, etc.)
We’ve listed instructions and options for the most common token values, or display formats. For a list of all available tokens for formatting your layout, visit Moment.js documentation.
Time format
You can personalize your time format by clicking on the current time format and selecting your preferred layout. For even more freedom, select the Custom option to create your own unique timestamp format.
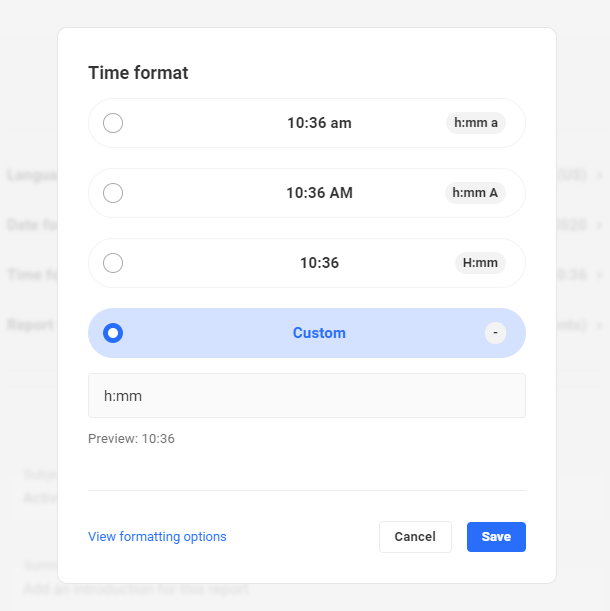
The current default options for you to choose from are:
- h:mm a – Which shows as 10:36 am.
- h:mm A – Displays as 10:36 AM.
- H:mm – This uses 24-hour display and shows as 10:36.
If you decide to opt for a custom time format, you can type in your desired format by using the following token values:
- h – A minimum one-digit hour with the 12-hour clock (e.g 2 for 2 o’clock in the afternoon).
- H – A minimum one-digit hour with the 24-hour clock (e.g 14 for 2 o’clock in the afternoon but 2 for 2 o’clock in the morning).
- m – A minimum one-digit minute (e.g 8 for 8 minutes and 14 for 14 minutes).
- s – A minimum one-digit second (e.g 8 for 8 seconds and 14 for 14 seconds).
- a – Displays the relevant am or pm in lowercase letters.
- A – Displays the relevant AM or PM in uppercase letters.
Note: Doubling the abbreviation for h, H, m and s will display a minimum of two-digits for the corresponding value. For example, hh would show 02 for 2 o’clock in the afternoon instead of 2 when only one “h” is used.
The preview underneath the input field will give you an idea of how your time format will end up looking.
Remember to click Save to keep your settings.
Report type
The report type allows you to gauge the amount of detail included in the report, based on who will be reading it. Select Summary for a report that includes only the essential information, intended for clients. Or you can choose Detailed for a report that includes a bit more information, usually intended for developers, but really for anyone who would like a more detailed report.
See How Reports Data is Compiled below for details about the data that is included in your report.
17.1.2 Email Content
Link to chapter 1This is where you can edit your email structure by customizing the following fields:
- Subject – Your usual email subject.
- Summary (optional) – A short introduction to the report.
- Report filename domain – The filename for your report.
- Main content – The body of your email.
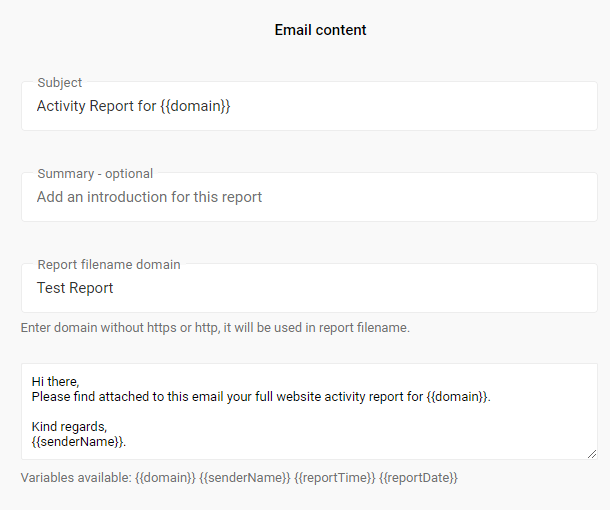
You can use variables to simplify the customization of your reports. The currently available variables are:
- {{domain}} – Your site’s domain name.
- {{senderName}} – Inputs the name of the sender.
- {{reportTime}} – Adds the time of the report.
- {{reportDate}} – The date on which the report was compiled.
Reports will only be sent to users that have subscribed, with the exception of the account email which doesn’t require you to subscribe. This is explained further here.
17.1.3 Services
Link to chapter 1Choose which services you want to include in your report by checking the checkbox next to each one, or check the box at the top to include them all.
Only the services that are currently active in your Hub for the site you’re preparing the report for will be available for selection. If any service is not yet active on the site, it will appear greyed out in the list with a tooltip reminder that you’d need to first activate it to include it in the report.

Below are the services that can be included in your report if active.
- Updates
- Security
- Performance
- SEO
- Backups
- Uptime
- Analytics
- Client Billing
- Broken Link Checker
You can rearrange how the services should appear in your report by dragging & dropping them into the order you prefer. Note that this is not a global adjustment; it must be done for each report that you want to re-order.
See How Reports Data is Compiled below for details about the data that is included in your report.
17.1.4 Cover Page
Link to chapter 1Once you have sorted out the content of your report, you can edit the look of it to make it more cohesive with your brand. The cover page settings give you control over the following design aspects:
- Font
- Brand
- Logo

Font
Change the font color by clicking on the Font tag. You can adjust the picker to select the perfect color or even enter a hex color code if you have a very specific color in mind.
Brand
Adjust your background color by clicking on the Brand tag. In the same fashion as the font setting, you can do this by moving around the color picker or by entering a hex color code.
Logo
Upload your own logo to complete your report branding by clicking on Add a logo. Ensure that this logo is no larger than 1M and we suggest using a logo that either has a transparent or white background. Click Save to save your logo.
17.1.5 Generate
Link to chapter 1The generate section focuses on the email sender details. You have full control over the following report attributes:
- Email Sender
- Sender name
- Reply-to
- Schedule
- Recipients

Email Sender
By default, reports are sent from our white-labeled site-reports.com domain. But you can change that to any of your domains where you have both The Hub Client plugin activated and the SMTP module in the Branda plugin configured.
The Hub Client contains the engine needed to white-label the Hub, including adding your custom domain to the ones that can be used for the email sender address.
Having the SMTP module in Branda configured ensures your report emails are sent from your domain, and not from our default [email protected] address. It also ensures that report emails sent from your domain are not bounced by email clients, or wind up in spam folders.
To change the Email Sender to one of your domains configured as above, click on the current domain displayed there. That will pop open a modal window where you can select from one of your available domains instead.
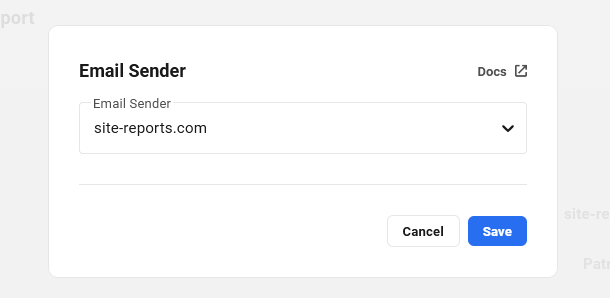
Click on the dropdown to see all your available domains, and select the one you want to use for your report.

Sender name
Edit this by clicking on the current name and replacing it with your preferred sender name.
Reply-to
This is the email address that will be used if a recipient replies to the email. By default, it will be your admin email address but this can easily be changed at any point.
Schedule
You can create a report schedule which will trigger a report to be sent to all recipients based on the schedule you set. Click Add to get started with scheduling your reports.

Click on the Schedule toggle to make the settings available. From there you can choose how often you want your report to be sent. Currently, you can choose from:
- Weekly – Once a week.
- Fortnightly – Once every two weeks.
- Monthly – Once a month.
- Quarterly – Once every 3 months.
You can select which day of the week you want your schedule to run on, as well as the specific time. If you would like to use a different timezone, click on the Change timezone text which will take you to your WPMU DEV account settings. Remember to click Save when you are done.
See How Reports Data is Compiled below for details about the data that is included in your report.
Note that this feature is not available to free Hub users. See Free Hub Restrictions for details.
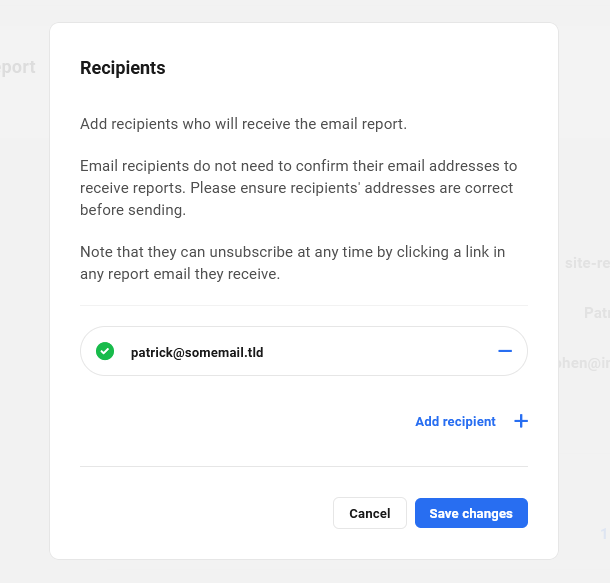
Recipients
Add recipients to receive the regular email report. Your admin email address will be added by default but this can be changed. Note that new recipients do not need to confirm their email addresses, so it’s good idea to double-check that they’re correct before sending the report. Recipients can unsubscribe at any time by clicking a link in any report email they receive.
Note: If the Schedule feature is disabled, you will not be able to add more recipients to your list. However, already subscribed recipients will still receive the reports. Enable the Schedule to add more recipients.
Send Report Right Away
Check the Send report right away box to receive a copy of the report immediately. Note that this option only appears if you have configured a Schedule for your report.
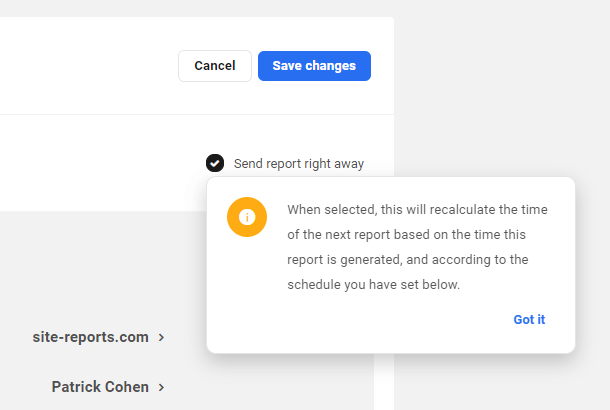
Note that if you edit a scheduled report and check the option to Send report right away, the report schedule will be automatically updated. The time of the next report will be recalculated based on the time you send this report, and according to the schedule you have set above. A tooltip will pop up to remind you of this.
17.2 Manage Reports
Copy chapter anchor to clipboardThe Reports feature keeps track of all your site reports and allows you to manage your schedules all from one place. You can handle your current reports, revisit old reports and access the technical documentation (this document) for more information.
17.2.1 Dashboard
Link to chapter 2The dashboard module gives an overview of your reports with key information and quick-access management tools.

The Scheduled Reports area shows the number of reports that are currently active for scheduling. See the Generate section for a walkthrough of configuring your report schedule. The Next Report area displays the name of the report that is next in line to be generated, along with the date and time it will be sent based on your schedule settings.
You will also find a list of your reports with a breakdown of all the important information related to the report. These key bits of information cover:
- Report – The name that you have given the report. This can easily be changed at any point by accessing the report tools, as explained later in the document.
- Type – Shows the type of report layout chosen. This will display as Client if you have gone for the Summary option and it will display as Dev if you have opted for the Detailed report.
- Service – The icons represent the features you have chosen to include in your report. Hover over any icon to view the feature label.

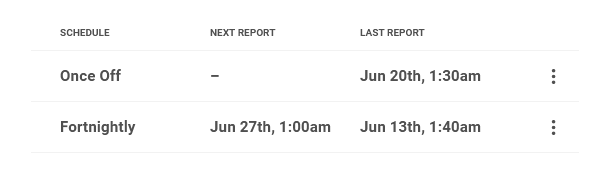
- Schedule – You can expect a blank field with a dash here if your report isn’t scheduled. However, if you have scheduled your report, this field will show you how often your report will be generated.
- Next Report – This tells you the date and time of when you can expect the next report to be sent. If your report is unscheduled and was just a one-time necessity, it will be marked as Once Off.
- Last Report – Shows the last time a report was generated.
To access your management tools, click on the three-dot icon in the same row as the report you want to edit. This will open a drop-down menu with the following features:
- Manage – This will take you to the same settings you configured when you first created the report.
- Duplicate – Create a copy of the report with the same schedule and the same services included.
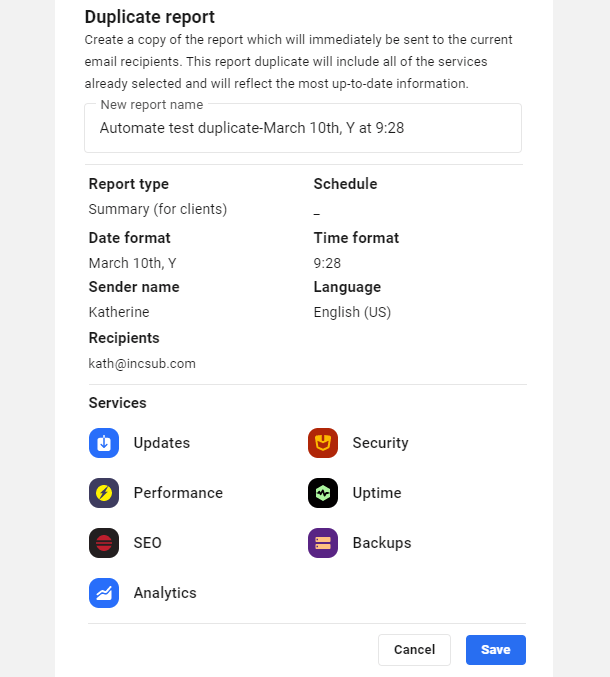
By default, the duplicate report name will include the date and time of the new report, but you can change the name to whatever you like. A summary of the report details and the included services will also be displayed. Click Save when you are ready to proceed or click Cancel to exit the duplication process. You can edit the duplicate afterward by clicking the Manage option in the duplicate.
- Rename – Allows you to easily edit the report title. Remember to click Save to keep your changes.
- Download last report – Triggers a download of the latest report from that report schedule in a PDF format.
- Email last report – Allows you to quickly configure your Email Content and Recipients to immediately send the last report.
- Delete – Permanently remove that report schedule.

Note that for once-off reports, the available options are Duplicate, Rename & Delete only. When you duplicate a once-off report, it is immediately sent to the same email recipients as the original, with the most up-to-date information included.

17.2.2 History
Link to chapter 2All of your reports are tracked and logged in your History module.

This allows you to revisit old versions of your scheduled reports and download them as a PDF. The Number of Reports shows you the total number of reports that you have generated and the Total Recipients shows you the total number of recipients of your past reports. Recipients are counted for each report as individual additions to the total, even if they are the same as previous reports.

Old reports will be listed with the following pieces of information:
- Report – The name of your report.
- Size – Shows the total size of the report.
- Created – Displays the date and time that the report was created.
- Scheduled – Provides the frequency, day and time of that report’s schedule.
- Recipients – The number of recipients that there were for that particular report.
Note: All reports are stored for up to 90 days and will automatically be removed after that.
17.3 How Reports Data is Compiled
Copy chapter anchor to clipboardThe data that is collected and compiled for a report depends on the report type, the specific services selected and the report schedule. The data included for each service will differ depending on retention and how queryable the data is.
Note that any report can take up to 30 minutes on average to be compiled and emailed to recipients.
17.3.1 Data by Report Type and Service
Link to chapter 3The two available report types – Summary and Detailed – contain different kinds of service information depending on how granular you need the report data to be.
The list below provides a guide to what is included in each report type:
Updates
- WordPress Core status
- Plugins & Themes Update Log (only Summary)
- Plugins & Themes (Detailed)
- Update Log (Detailed)
Note that any services that have ignored updates will not be included in the Plugins & Themes section of the Detailed report. Please visit the Updates documentation for more information on blocking and unblocking updates.
Security
- Security Tweaks (Detailed)
- File scanning
- Blacklist Monitor
- IP Lockouts
SEO
- SEO Score (only Summary)
- Detailed SEO Crawl Report (Detailed)
Performance
- Performance Test Score
- Score Metrics (Detailed)
- Audits (Detailed)
- Historic Field Data (Detailed)
Backups
- Backups overview
- Storage Used (Detailed)
Uptime
- Statistics
- Response Time
Analytics
- Traffic
Broken Link Checker
- Broken Links
- Total Links Found
- Unique URLs
- Next Scheduled Scan
Client Billing
- Monthly Recurring Billing
- Active Subscriptions
- Net Billing
- Outstandng Invoices
- Active Subscriptions – full list (Detailed)
- Outstanding Invoices – full list (Detailed)
17.3.2 Data by Report Schedule
Link to chapter 3In addition to the kinds of data included for each service and report type as noted above, the amount of data included in each report will vary according to the report schedule.
As an example, let’s say you’re setting up a report to be run quarterly. When the report runs, the system will attempt to collect data for the last 3 months, or the last 90 days, depending on the service. If a particular service does not retain data for the specified period of time, the report will contain data from the last 30 days, or from the most recent scan.
Here’s a breakdown of the data that would be included in a report, either once-off or scheduled:
- Security
- Malware Scan – Data from the most recent scan that was run in the last 24 hours is included. If no scan was run in the last 24 hours, we trigger a new scan and include that data.
- Blocklist Monitor – Only the current status is included, regardless of the report frequency.
- Performance – We trigger a new scan and compare it with the previous scan if one exists, regardless of the report frequency.
- Average page load time – Data from the last 7 days is compared to data from the previous 7-day period.
- SEO – Data from the most recent scan that was run in the last 24 hours is included. If no scan was run in the last 24 hours, we trigger a new scan and include that data.
- Broken Link Checker – Data from the most recent scan that was run in the last 24 hours is included. If no scan was run in the last 24 hours, we trigger a new scan and include that data.
- Backups – Only data from the most recent WPMU DEV hosting or Snapshot backup performed in the reporting period is included, regardless of the report frequency.
- Uptime – Data from the last 30 days is always included, regardless of the report frequency.
- Updates – The current list of updates available, plus a log of all updates performed in the reporting period, either via the Hub or directly on the site. Data from the last 7 days is included in Once Off reports.
- Analytics – Statistics data for the selected reporting period is included. Data from the last 30 days is included in Once Off reports.
- Client Billing – Only the current status of all billing, invoicing & subscription data is included, regardless of the report frequency.
17.4 Get Support
Copy chapter anchor to clipboardIf you still have questions or need assistance after reading this document, please don’t hesitate to contact our support superheroes using the available options under the Support tab in your Hub or via the Support tab in your WPMU DEV Dashboard.


